
| Previous Top Next |
| Plotted Results |
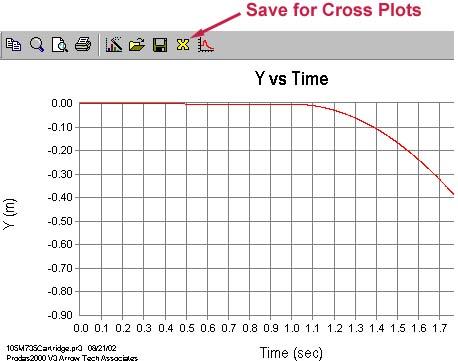
We now are going to take a look at the plots to verify there was an effect. We also will send the data to a cross plot so we can check the motion when compared to the non-controlled baseline.
Do the following;
 to open a new X-plot window.
| © 2002 Arrow Tech Associates |