
| Previous Top Next |
| Output Setup |
You can setup the output many different ways. The plots and printed output can be based on time or distance. You also set the time base for the 3D visualization as well as the FCS Visualization from this tab.
We are going to setup the Low Res Plot Output Interval- Time value and then have the FCS Visualizer use that value for data collection.
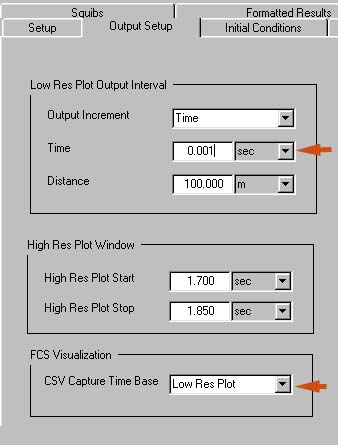
The low resolution output increment is set to time rather than distance. In this case it is easier to evaluate the results. The FCS visualizer is set to low resolution so it is time based with an increment of .001 seconds.
| © 2002 Arrow Tech Associates |