
Now that the inputs to setup the analyses have been defined, you now need to indicate which
outputs you want to save from each analysis run.
The Analysis BOT allows you to save three types of outputs:
- Data tables to cross plot - All cross plots are based on data tables. Selecting a data table will save a copy
of the table for each run. The comments you entered when selecting the projectiles will be used as a legend key.
- Data items to tabulate into a summary table - This will produce a data table of these items which then can be copied
into a spreadsheet for further analysis.
- Text output compilation - Most analyses produce a text output that is generally displayed on the Formatted Output tab of the Form. The text output that you choose will be a compilation of the output for each run and viewed in a single window
For this tutorial select;
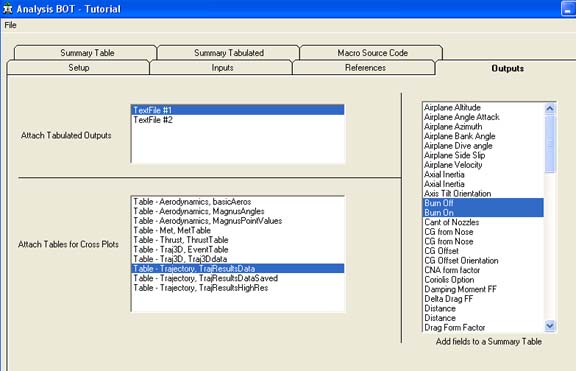
- TextFile #1 from the "Attached Tabulated Outputs" listbox
- Table - Trajectory, TrajResultsData from the "Attached Tables for Cross Plots" listbox
- Burn On, Burn Off and Quadrant Elevation from the "Add Fields to a Summary Table" listbox. Note that you have to scroll down to see Quadrant Elevation.
Previous
Top
Next