| Previous Top Next |
| View Cross Plot |
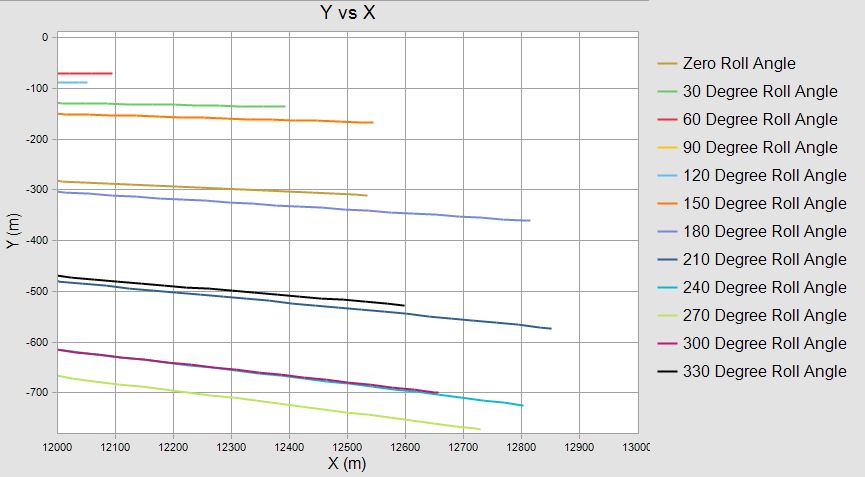
The Y vs X cross plot shows the theoretical footprint. To focus in on impact, I zoomed in to display the region of X from 12000 meters to 13000 meters.
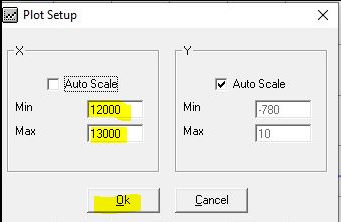
The two screen captures below show the process of specifying the plot area. To change the plot scale, click the icon shown on the left below in the Cross Plot task bar. I defined the Min and Max for X and let the plot autoscale Y. The plot scaling entry screen is shown in the right screen capture.
|
|
The user should keep in mind that the 6 DOF with trades can be used to generate 1000 impacts based on input error levels for various trajectory inputs. This information would allow the user to compare the predicted performance of the system they design versus control options such as canards, thrusters, spin stabilized, statically stable platforms and choose the best scheme to meet performance and budgetary requirements.
The screen capture below is the theoretical footprint.
| © 2025 Arrow Tech Associates |