
| Previous Top Next |
| P1 vs Time |
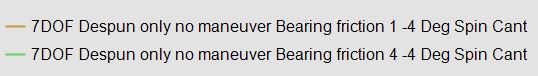
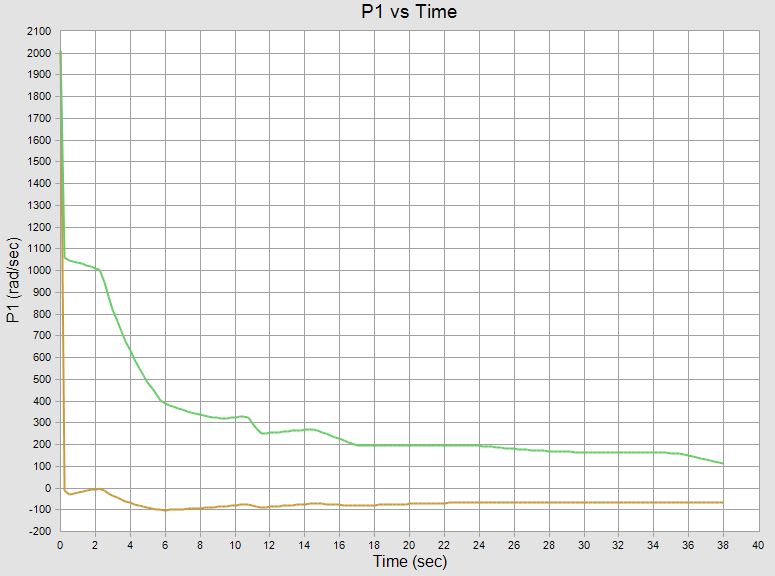
The following chart shows the Cross Plot of "P1 vs Time". P1 is the Nose Roll rate. This cross plot is stored in the 7DOF cross plot group.
This plot shows the nose spin rate for the two cases. Note that the higher bearing friction coefficient combined with the -4-degree roll cant cannot overcome the bearing friction and reduce the nose spin rate to zero. Comparatively with a bearing friction of 1 the -4-degree roll cant brings the nose down very close to 0 roll rate.
| © 2025 Arrow Tech Associates |