
| Previous Top |
| Comparing the results of the "With Controls" and "No Control" simulations |
In this section the user will manipulate the Cross Plot module to view various combinations of the output data. Specific plots for this section will be Time vs Beta, X vs Y, and X vs Velocity.
Maximize the Crossplot window plot and select Time vs Beta.
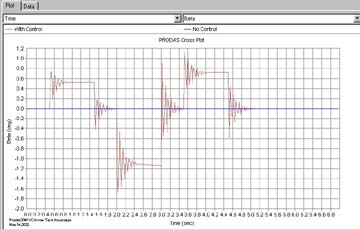
From this image we can see the reaction of the projectile in the horizontal plane (Red Data/With Control) to the controlled deflections of the forward canards.
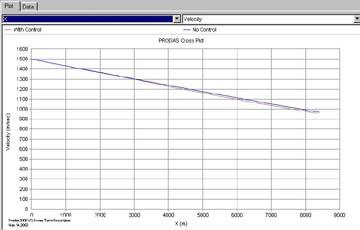
This image compares the downrange velocity performance of each flight control configuration. From this we can see the velocity change caused by the increased drag due to the angle of attack variations shown in the previous image.
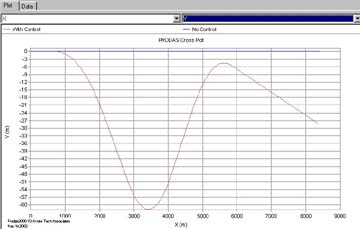
This image compares the down range deflection performance of each flight configuration.
If the images presented in this section do not match up with the images generated by the user, please review to the formated output section of this tutorial. The user can use this information to verify the setup, initial conditions, and flight control input data.
| © 2002 Arrow Tech Associates |